


 Your new post is loading...

|
Scooped by Robin Good |

Robin Good's insight:
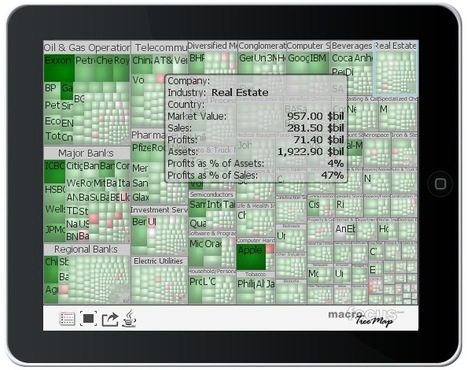
Silk is a web tool to publish online spreadsheet-based data on a specific topic.
The service, which just released a new version of its offering, allows to easily convert any existing data-set into professional-looking data displays, charts, grids, and lists that can be embedded on any site and which can be viewed in multiple ways.
The value of Silk is specifically in making it easy and immediate for anyone to elegantly display and publish data sets in one of several alternative formats which include:
- Table
- List
- Grid
- Mosaic
- Groups
- Bars
- Map
- Donut
- Line
- Pie
- Scatter
- Stacks
How it works: Import a table from Excel, Google Sheets or any .csv file, select the fields you want to import and Silk does the rest offering you tools to filter, edit and select your preferred visualization approach.
You can also create data sets and displays from scratch inside Silk, and set each Silk either as public or private.
Why it is relevant for content curators: Silk provides a unique and powerful opportunity to leverage existing data and information assets, spreadsheets and databases and to convert them into highly legible and visually impactful data displays on a very specific topic.
My evaluation: Paired with the power of Kimonolabs or Import.io to convert any website or page content into a spreadsheet, it offers great potential in creating value by providing multiple professional formats to display, present and interact with such data.
Great tool for curating data-based information assets.
Free forever for public Silks of up to 3000 pages.
Try it out now: https://www.silk.co/
Video tutorials: https://www.silk.co/product


Silk is a web tool to publish online spreadsheet-based data on a specific topic.
The service, which just released a new version of its offering, allows to easily convert any existing data-set into professional-looking data displays, charts, grids, and lists that can be embedded on any site and which can be viewed in multiple ways.
The value of Silk is specifically in making it easy and immediate for anyone to elegantly display and publish data sets in one of several alternative formats which include:
Table ListGrid MosaicGroupsBarsMapDonutLinePieScatterStacksHow it works: Import a table from Excel, Google Sheets or any .csv file, select the fields you want to import and Silk does the rest offering you tools to filter, edit and select your preferred visualization approach.
You can also create data sets and displays from scratch inside Silk, and set each Silk either as public or private.
Why it is relevant for content curators: Silk provides a unique and powerful opportunity to leverage existing data and information assets, spreadsheets and databases and to convert them into highly legible and visually impactful data displays on a very specific topic.
My evaluation: Paired with the power of Kimonolabs or Import.io to convert any website or page content into a spreadsheet, it offers great potential in creating value by providing multiple professional formats to display, present and interact with such data.
Great tool for curating data-based information assets.
Free forever for public Silks of up to 3000 pages.
Try it out now: https://www.silk.co/ ;
Video tutorials: https://www.silk.co/product ;