Didactics and Technology in Education
107.6K views | +0 today
Follow
Didactics and Technology in Education
Almost "everything" about new approaches in Education
Your new post is loading...
Rescooped by Rui Guimarães Lima from Amazing Science
Scoop.it!

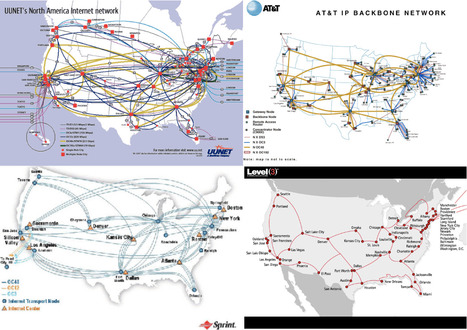
40 Maps that explain the Internet and its history

40 Maps that explain the Internet and its history | Didactics and Technology in Education | Scoop.it

good example of content curation at work is the Vox feature collection entitled "40 maps that explain the internet", which showcases in a highly digestible and visual format where the Internet came from, how it works, and how it's used by people around the world.


Although at first glance this may look just as a list of maps with descriptions, there's a lot of curation work that can be appreciated by looking just a bit beyond the surface. 

a) Titles and descriptions are well crafted, short, focused, but consistently clear and to the point. 


b) The 40 maps are intelligently organized into six different groups: 

  1. How the Internet was created
  2. The Internet around the world
  3. Threats to the Internet
  4. The geography of online services
  5. How America gets online
  6. How we use the Internet


c) Images of maps sourced from elsewhere are properly credited and linked. 


To the ignorant eye, this will look like "oh, just another collection of maps", but to the avid reader, scholar and to the curious enough to look beyond appearances, the value of this editorial work is on how it perfectly hides the amount of complexity and research work it has required while organizing and presenting an extremely clear and comprehensive body of valuable information on the chosen topic.


Curated by Timothy B. Lee together with editor Eleanor Barkhorn,

designer Uy Tieu and developer Yuri Victor.


A good example of curation at work. 8/10


Full feature: http://www.vox.com/a/internet-maps 


Via Robin Good, Dr. Stefan Gruenwald
Robin Good's curator insight, June 8, 2014 4:45 AM


A good example of content curation at work is the Vox feature collection entitled "40 maps that explain the internet", which showcases in a highly digestible and visual format where the Internet came from, how it works, and how it's used by people around the world.


Although at first glance this may look just as a list of maps with descriptions, there's a lot of curation work that can be appreciated by looking just a bit beyond the surface. 

a) Titles and descriptions are well crafted, short, focused, but consistently clear and to the point. 


b) The 40 maps are intelligently organized into six different groups: 

  1. How the Internet was created
  2. The Internet around the world
  3. Threats to the Internet
  4. The geography of online services
  5. How America gets online
  6. How we use the Internet


c) Images of maps sourced from elsewhere are properly credited and linked. 


To the ignorant eye, this will look like "oh, just another collection of maps", but to the avid reader, scholar and to the curious enough to look beyond appearances, the value of this editorial work is on how it perfectly hides the amount of complexity and research work it has required while organizing and presenting an extremely clear and comprehensive body of valuable information on the chosen topic.


Curated by Timothy B. Lee together with editor Eleanor Barkhorn,

designer Uy Tieu and developer Yuri Victor.


A good example of curation at work. 8/10


Full feature: http://www.vox.com/a/internet-maps 


Francisco Morfin's curator insight, June 9, 2014 7:29 PM

Mapas sobre Internet en el mundo

Gonzalo Moreno's curator insight, June 10, 2014 7:20 AM

40 mapas que explican INTERNET

Chulísimo!!

Rescooped by Rui Guimarães Lima from Content Curation World
Scoop.it!

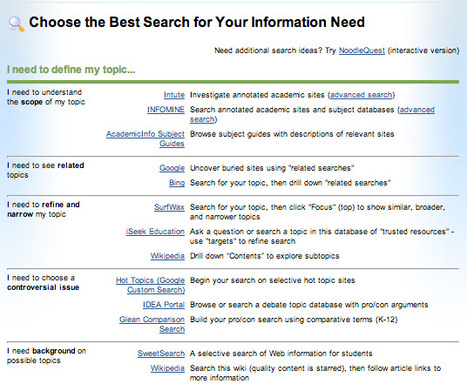
A Curated Collection of The Best Search Engines Organized Around Your Needs

A Curated Collection of The Best Search Engines Organized Around Your Needs | Didactics and Technology in Education | Scoop.it

Via Robin Good
Steve Whitmore's curator insight, June 17, 2014 7:59 AM

Good reference list. I didn't realize there were so many search engines.

Pushpa Kunasegaran's curator insight, June 19, 2014 7:58 PM

This is an excellent resource!

ManufacturingStories's curator insight, August 14, 2014 5:22 PM

For more resources on Social Media & Content Curation visit http://bit.ly/1640Tbl

Rescooped by Rui Guimarães Lima from e-Xploration
Scoop.it!

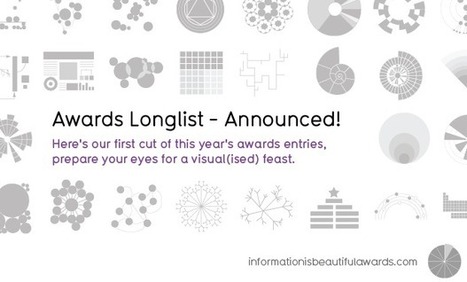
A Curated Selection of Data Visualization Charts and Infographics: The Information Is Beautiful Awards

A Curated Selection of Data Visualization Charts and Infographics: The Information Is Beautiful Awards | Didactics and Technology in Education | Scoop.it

Robin Good: David McCandlees, the author of the book Information is Beautiful celebrates great data visualization and information design work through the Information is Beautiful Awards.

Together with a jury of experts like Brian Eno, Paola Antonelli, Maria Popova, Simon Rogers and Aziz Kami, he has curated a unique selection of 300 designs and a short list of finalists in the following categories:


» Data visualization– A singular visualisation of data or information.» Infographic – Using multiple data visualisations in service to a theme or story


» Interactive visualization – Any viz where you can dynamically filter or explore the data.


» Data journalism – A combination of text and visualizations in a journalistic format.


» Motion infographic – Moving and animated visualizations along a theme or story.


» Tool or website – Online tools & apps to aid datavizzing.


The selection itself is worth a tour of the site and of this initiative.


Check: http://www.informationisbeautifulawards.com/


Longlist selection: http://www.informationisbeautifulawards.com/2012/07/our-longlist/


Shortlist selection: http://www.informationisbeautifulawards.com/2012/08/awardshortlist/


Via Robin Good, luiy
No comment yet.