


|
Rescooped by malek from Daily Magazine |

malek's insight:
Warning: extremely addictive for stats non-savvy

Get Started for FREE
Sign up with Facebook Sign up with X
I don't have a Facebook or a X account


|
digital marketing strategy
Think | Visualize strategic marketing planning Curated by malek |
 Your new post is loading...
|
|
Rescooped by malek from Daily Magazine |
Warning: extremely addictive for stats non-savvy
|
|
Rescooped by malek from visualizing social media |
![How to Effectively Use Visual Content in Social Media Marketing [infographic] | digital marketing strategy | Scoop.it](https://img.scoop.it/yc5XoeXYbpFORrXfBCtXqTl72eJkfbmt4t8yenImKBVvK0kTmF0xjctABnaLJIm9)
Social media has trended towards visual content. In the past two years, Facebook launched Timelines, Pinterest became the third most popular social network, and Google+ relaunched with a visual-centric interface. Visual content allows you to craft a distinct brand identity, garner new interest, and connect on an emotional level with customers and fans. In short, a picture is worth way more than a thousand words.


This certainly makes a lot of sense and while most of us like using visual elements, if you like me, we have been a bit slow it making use of this valuable component. Instagram is one area that has shown itself to be a viable marketing tool. Its pleasing to use because there is so much material around in the form of motivational quotes etc and you can put your own creative touches to images to help with your own branding.
|
|
Rescooped by malek from Great Infographics |
![What Does a Day in Social Media Look Like? [Infographic] | digital marketing strategy | Scoop.it](https://img.scoop.it/OLyOWGpFWN3QSdHG45cqRjl72eJkfbmt4t8yenImKBVvK0kTmF0xjctABnaLJIm9)
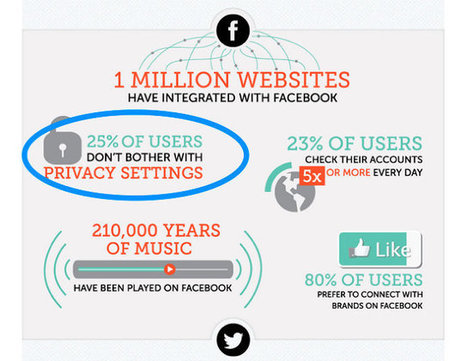
Of the world's roughly 7 billion people, 40% use social media daily. So, what are those folks doing on the major social platforms?
The following infographic by Saxum shows the daily activity on Facebook, Twitter, LinkedIn, Pinterest, Vine, Google+, and Tumblr, measured against each platform's total user base.
On Facebook, some 23% of users check newsfeed more than five times a day, 2.7 billion people give Facebook posts a Like, and Twitter's active users contribute 400 million tweets a day...

Muy interesante! datos de trafico en RRSS a nivel mundial, 7 Billones de personas conectadas y el Prime Time a las 15h !
|
|
Rescooped by malek from Information Technology & Social Media News |
Know what the fastest-growing demographic on Twitter is? Or how many new members join LinkedIn every second? The answers will surprise you!
Demographics bombshell: Time to rethink your social media strategy
|
|
Rescooped by malek from Information Technology & Social Media News |

Gartner believes major changes are imminent to the world of BI and analytics including the dominance of data discovery techniques, wider use of real-time streaming event data and the eventual acceleration in BI and analytics spending when big data...
|
|
Rescooped by malek from visualizing social media |
![45 Amazing Social Media Facts of 2013 [Infographic] | digital marketing strategy | Scoop.it](https://img.scoop.it/-80FLjnbZ8zgaLTCTqO1Djl72eJkfbmt4t8yenImKBVvK0kTmF0xjctABnaLJIm9)
Everyday Social Media numbers are growing, and here are 45 facts in an infographic by Digital Insights.
A few of the statistics:
40% of marketers use Google+, 70% desire to learn more and 67% plan to increase Google+ activities 42% update their profile information regularly on LinkedIn Every second 8000 users like some or other photo on Instagram 80% of total Pinterest’s pins are re-pins 4.2 billion people use mobile device to access social media sites
Even more amazing facts; and these can be useful for marketers!

Interesting stats, but for the business marketer, does it convert to revenue?
|
|
Rescooped by malek from Curation, Social Business and Beyond |
![A Glimpse into The Mobile World In 60 Seconds [Infographic] | digital marketing strategy | Scoop.it](https://img.scoop.it/zwIobpoFw9o7fBl0_AtvVjl72eJkfbmt4t8yenImKBVvK0kTmF0xjctABnaLJIm9)
This article was written by Chris Velazco for Tech Crunch
The infographic from ad exchange, Mobclix in this piece aims to highlight what goes down in the mobile world in 60 seconds.
****Before you read the excerpt, I thought it was particularly interesting to post one of the comments made by a reader who saw the infograph. He wasn't the only one that said this was an unfinished report. I think these people are missing the point here.
**This is a mere glimpse, the tip of the iceberg, to give us an idea of the magnitude of this exploding industry, it's not the be all end all report. I'm very careful what I post, I don't want to add to the noise, so look at the infographic with this in mind and imagine how it would look if you added what one of the readers said below.
One reader's comment:
Ulrich Weihler: "Nice idea, but major things for spending mobile time are missing, surfing content, using communities, using apps, internet usage, downloading music and videos, listening to music or watching videos, sms and actually phone connecions to talk, etc.. that's why the chart looks a bit strange."
Excerpt:
"In case you were curious, in the time it took me to write out that first sentence, over 23,000 iOS apps were downloaded from Apple’s App Store.
** Mobclix used data directly from app publishers, industry sources, and a little old-fashioned arithmetic to get the 60 second stats you see below.
Of course, considering Mobclix’s background, there had to be some ad-related factoids in the mix too.
Mobile advertisers will be glad to know (if they didn’t already) that some 4,111 ads are tapped each minute, though it almost makes you wonder how many ads
were ignored in the same 60 second timeframe.
Curated by JanLGordon covering "The Explosion of Mobile Web & Beyond"
See Infographic [http://tcrn.ch/u4No0L]


On paper, it sounds incredibly boring. In practice, it is inexplicably addictive.
On paper, it sounds incredibly boring. In practice, it is inexplicably addictive.